
Fine-related revenue accounts for more than half of reported governmental-fund revenue in 13 of the 15 Louisiana communities compared here. Eros, Fenton, and Baskin each report a share above 80%. These are findings from selected public financial reports, not an exhaustive ranking of every Louisiana municipality or a count of traffic citations.
The qualification matters: municipal accounts often group fines, forfeitures, court costs, or tickets together. Those categories do not isolate traffic cases. We retain their actual labels and fiscal periods rather than describing every dollar as speeding-ticket money.
The comparison: reported fine-related revenue
The table divides the identified fine-related revenue line by the financial statement’s total revenue across governmental funds. It excludes business-type utility operations and amounts presented separately as other financing sources, such as transfers or borrowing. Each community’s name links directly to the relevant report and PDF page.
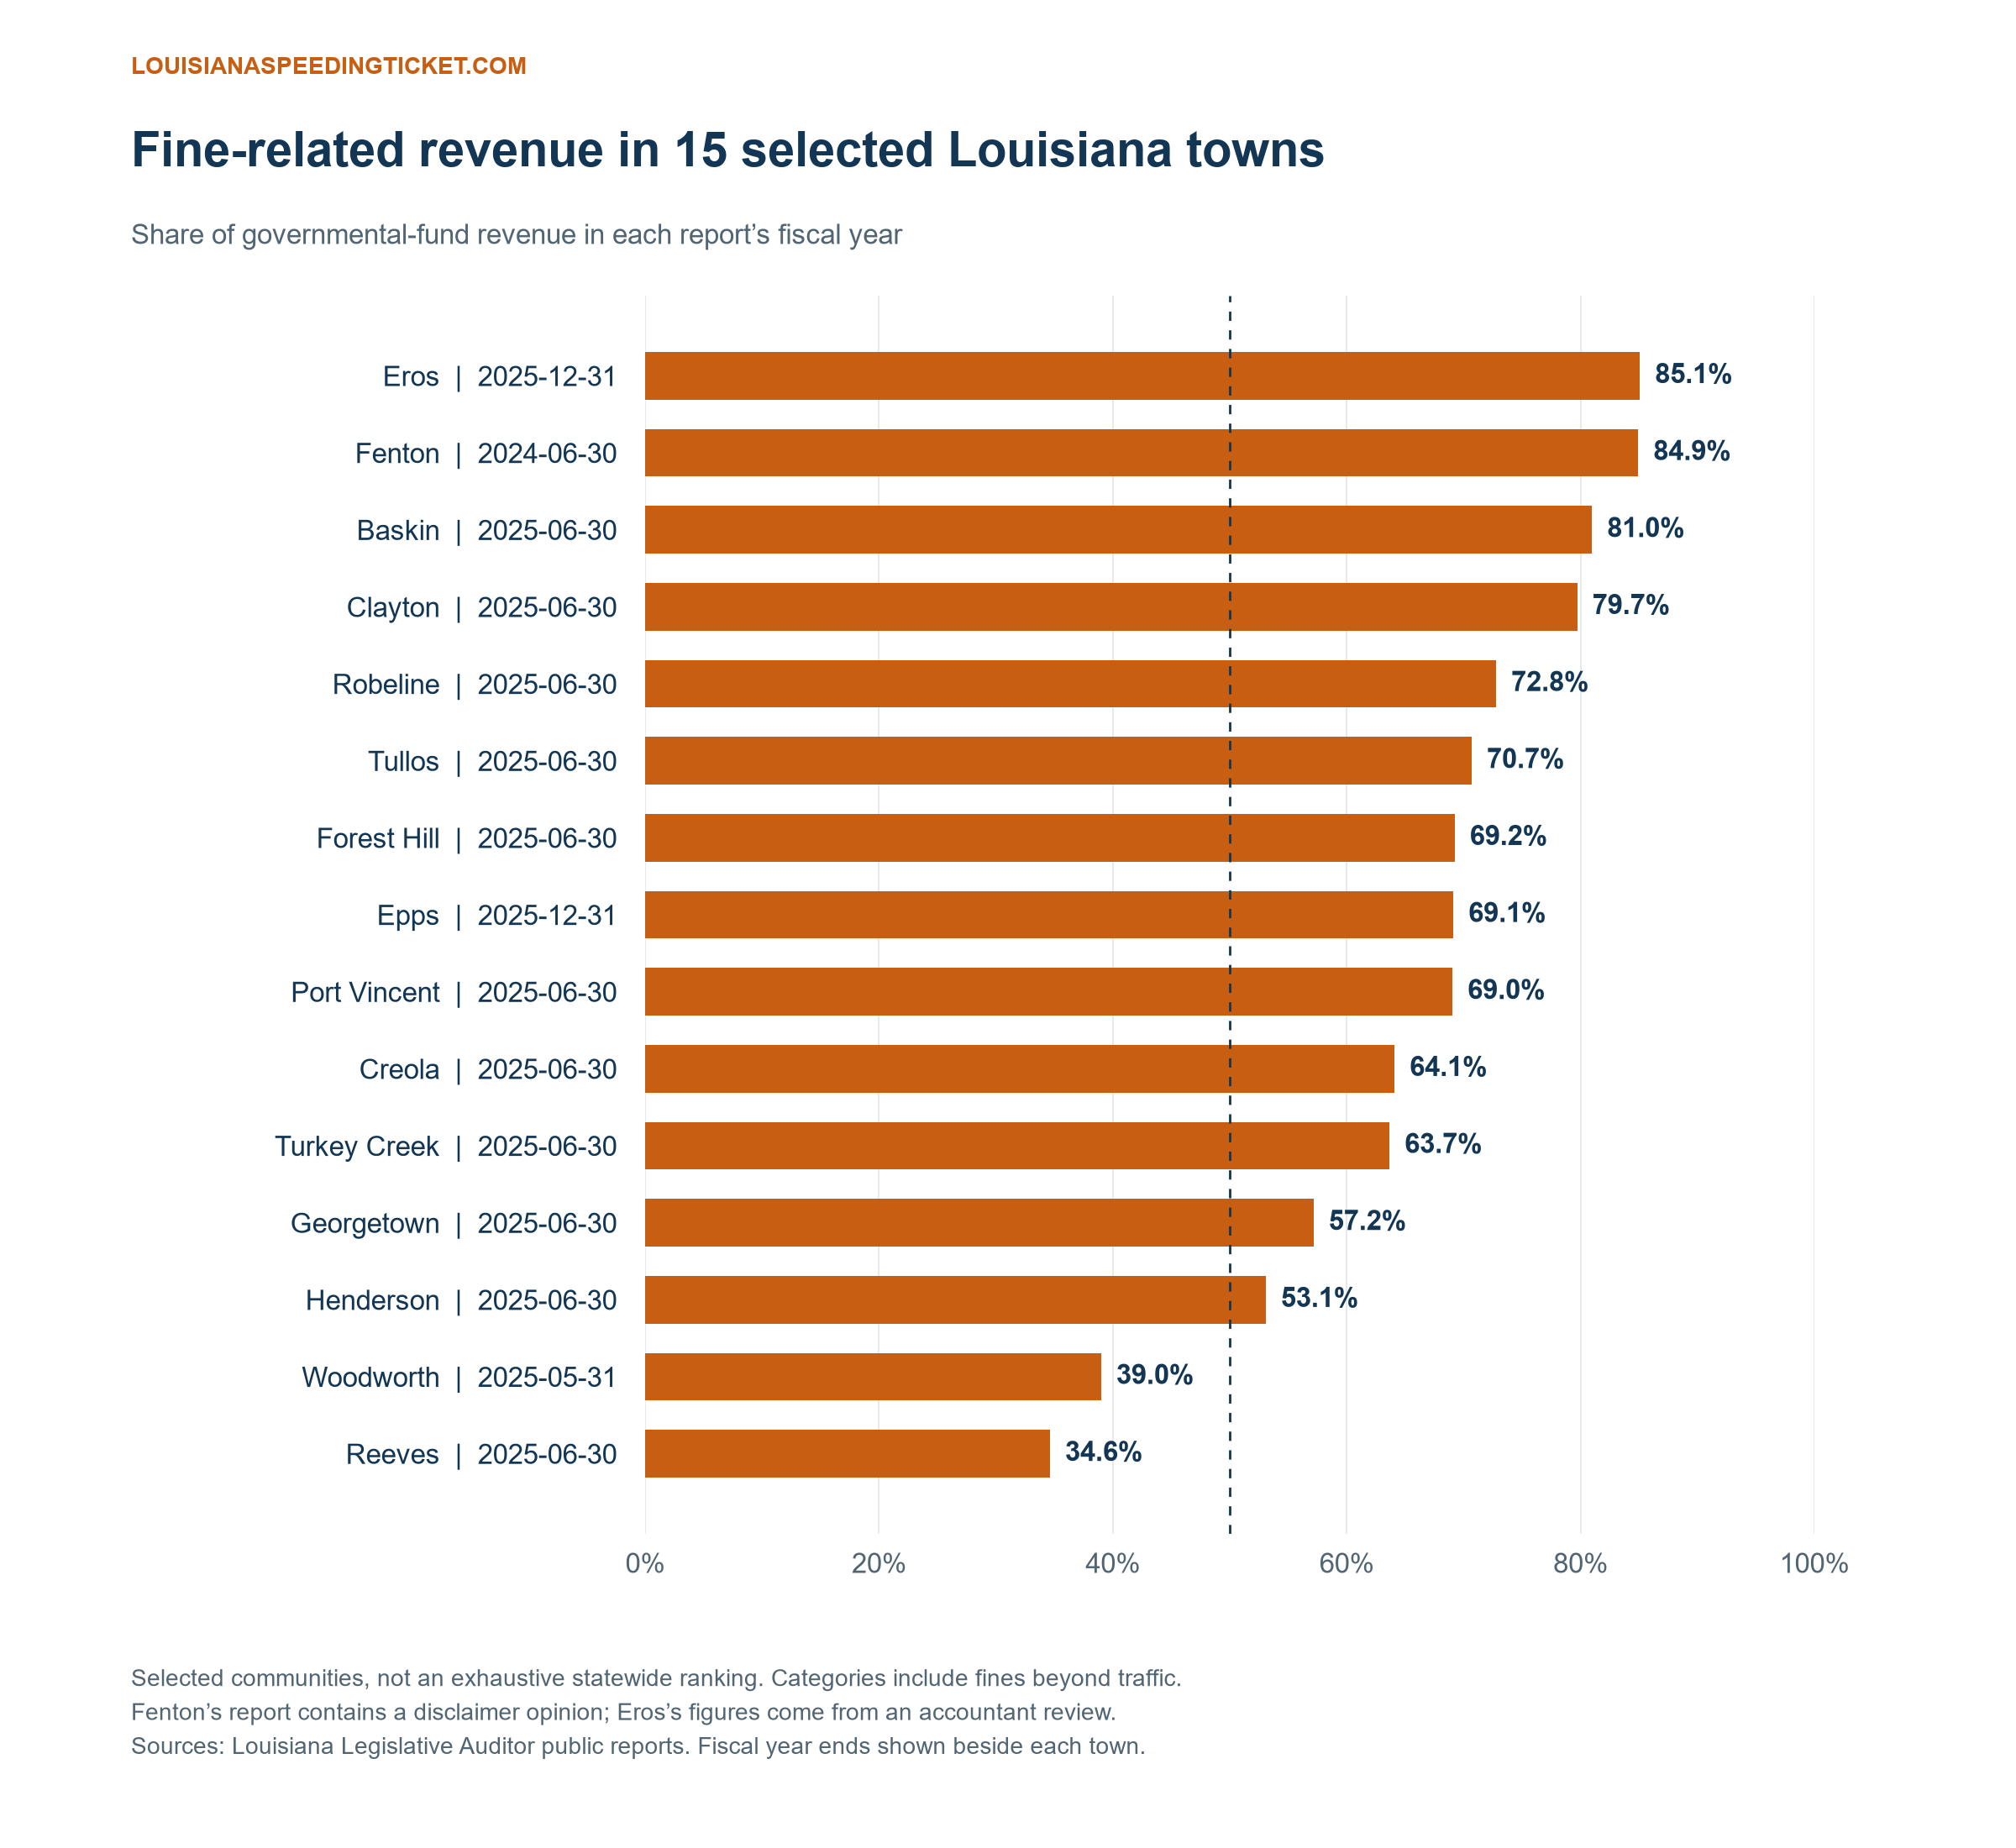
Download the source table (CSV) · Download the chart (PNG)
| Community / year ending | Fine-related revenue | Governmental-fund revenue | Calculated share |
|---|---|---|---|
| Eros Dec 31, 2025 | $294,647 | $346,389 | 85.1% |
| Fenton Jun 30, 2024 | $1,186,767 | $1,397,427 | 84.9% |
| Baskin Jun 30, 2025 | $540,216 | $667,180 | 81.0% |
| Clayton Jun 30, 2025 | $348,366 | $437,040 | 79.7% |
| Robeline Jun 30, 2025 | $400,754 | $550,728 | 72.8% |
| Tullos Jun 30, 2025 | $435,744 | $616,497 | 70.7% |
| Forest Hill Jun 30, 2025 | $660,738 | $954,483 | 69.2% |
| Epps Dec 31, 2025 | $265,849 | $384,678 | 69.1% |
| Port Vincent Jun 30, 2025 | $432,910 | $627,055 | 69.0% |
| Creola Jun 30, 2025 | $629,472 | $982,288 | 64.1% |
| Turkey Creek Jun 30, 2025 | $328,263 | $515,723 | 63.7% |
| Georgetown Jun 30, 2025 | $695,086 | $1,216,105 | 57.2% |
| Henderson Jun 30, 2025 | $2,117,485 | $3,990,265 | 53.1% |
| Woodworth May 31, 2025 | $1,425,631 | $3,656,156 | 39.0% |
| Reeves Jun 30, 2025 | $433,369 | $1,251,966 | 34.6% |
The three largest shares in this comparison
Eros reports $294,647 in fines and forfeitures against $346,389 in General Fund revenue for calendar 2025: 85.1%. Its report is an accountant’s review, which provides a different level of assurance from an audit. The financial figure does not reveal how many tickets produced it.
Fenton reports $1,186,767 in fines and forfeitures against $1,397,427 across governmental funds for the year ending June 30, 2024: 84.9%. Its General Fund-only denominator is $1,397,111, also producing 84.9% after rounding. The auditor disclaimed an opinion on the General Fund and governmental activities because sufficient evidence was unavailable. That limitation accompanies the figures; they are not independently certified as accurate.
Baskin reports $540,216 in its combined fines, forfeitures, and court-cost category against $667,180 in reported governmental-fund revenue for the year ending June 30, 2025: 81.0%. Its statement presents $16,802 in interest earnings separately under other financing sources. Our denominator follows the statement’s total-revenue line; changing that treatment would change the percentage.
The choice of fund can change the story
A General Fund often finances everyday municipal operations, while separate governmental funds may hold taxes or grants restricted to other uses. Looking only at one fund answers a different question from looking across all governmental funds. Neither is the same as including a water or sewer enterprise.
| Community | General Fund share | All governmental-fund share |
|---|---|---|
| Reeves | 79.5% | 34.6% |
| Henderson | 78.0% | 53.1% |
| Turkey Creek | 79.4% | 63.7% |
| Woodworth | 51.4% | 39.0% |
Reeves illustrates the difference sharply. Its General Fund reports $433,369 in fines and $545,281 in total revenue, yielding 79.5%. A separate town-hall grant fund reports $706,685. Including that fund raises governmental-fund revenue to $1,251,966 and reduces the calculated share to 34.6%. The fine amount did not change; the denominator did.
Henderson’s reported $2,117,485 in fines and forfeitures yields a 78.0% General Fund share and a 53.1% share across its governmental funds. Woodworth’s $1,425,631 yields 51.4% in the General Fund and 39.0% across governmental funds. A comparison that mixes those scopes without explaining them can produce a misleading ordering.
What a high share establishes
A high share shows that the identified fine-related line represents a large part of the revenue scope measured for that period. It can support questions about how a municipality would finance services if collections fell, how its court and enforcement functions are structured, and whether its reporting clearly separates revenue sources.
It does not, by itself, establish an officer quota, an improper stop, a traffic-only collection total, or the number of motorists cited. Revenue can also reflect the timing of payments and accounting treatment. A finding about the municipal finances is not a ruling on an individual citation.
How to reproduce the figures
- Open the linked report and use the stated fiscal year, not the date the report was released.
- Locate the actual governmental-fund revenue statement and its fine-related line. Do not substitute an original or amended budget.
- Use the same fund scope for numerator and denominator; keep business-type operations and separately presented financing sources distinct.
- Calculate fine-related revenue ÷ total revenue × 100, then round to one decimal.
- Read the accountant’s report and any qualification or disclaimer before describing the amount as verified.
Our selection highlights 15 communities with substantial reported fine-related revenue and available statements that could be inspected directly. It is not a random sample. The table should not be used to claim that these are the 15 highest shares statewide, or that the 13-of-15 result describes all Louisiana municipalities. The underlying labels range from fines alone to fines plus court costs; that difference limits precise comparisons.
A practical distinction for drivers
If you received a citation, use the charge, court, and response date written on the ticket. A town’s revenue percentage does not determine the amount you owe or whether the allegation is valid. Our Fenton update examines its audit in more detail. To discuss an individual Louisiana ticket, send our team the citation before its deadline.
Sources checked October 2, 2026. Financial periods end in 2025 except Fenton’s year ending June 30, 2024. This is an analysis of reported financial statements, with their stated assurance limits; it is not a traffic-only or exhaustive statewide dataset.