
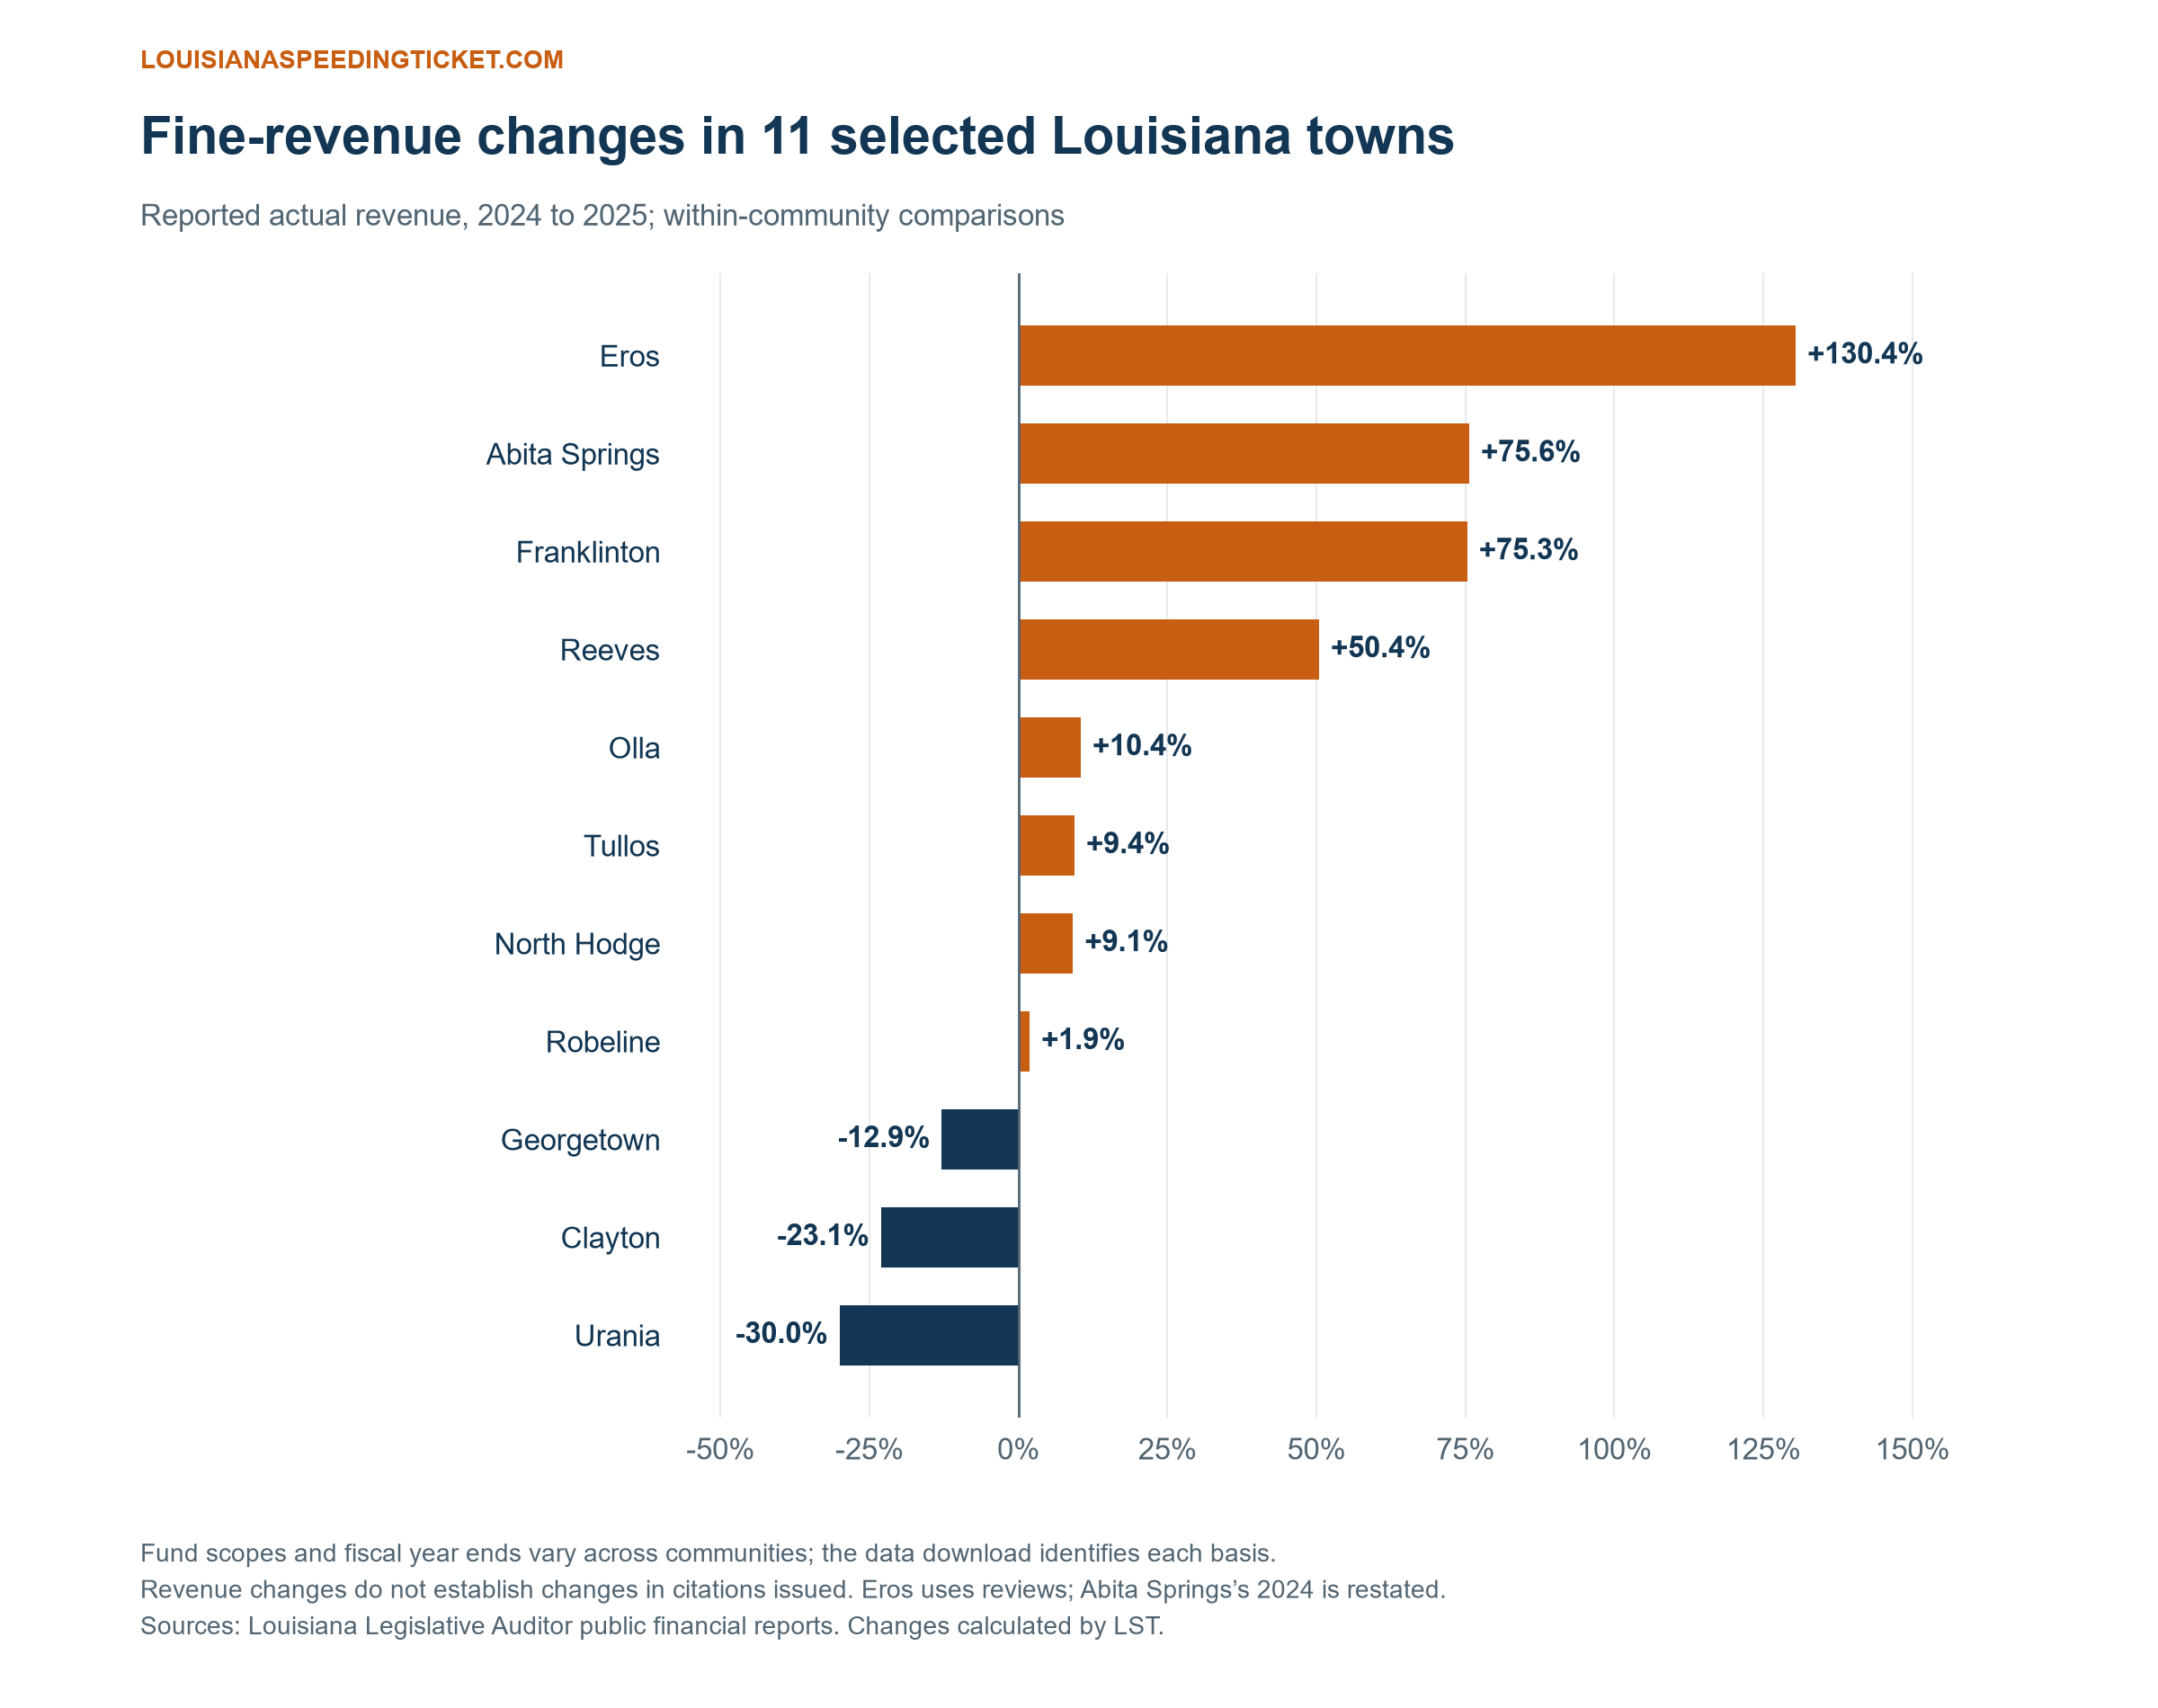
Which Louisiana towns collected more fine revenue in their newer financial reports? In an eleven-community comparison, Eros reports an increase of $166,757, or 130.4%, from 2024 to 2025. Reeves reports an increase of $145,270, or 50.4%. Several other communities show decreases.
These findings concern reported fine-related revenue, not the number of tickets issued. The comparison uses actual financial-report figures within each community. It is a selected set of public reports, not an exhaustive statewide ranking, and the categories can include fines beyond traffic offenses.
Eight communities with reported increases
Each linked town name leads to its financial report. Percentage changes are calculated as the difference between the two years divided by the 2024 amount. Dollar and percentage changes answer different questions: a large percentage increase from a small starting amount can be smaller in dollars than a modest increase elsewhere.
Download the source table (CSV) · Download the chart (PNG)
| Community | 2024 reported | 2025 reported | Calculated change |
|---|---|---|---|
| Eros | $127,890 | $294,647 | +$166,757 (+130.4%) |
| Abita Springs | $29,542 | $51,878 | +$22,336 (+75.6%) |
| Franklinton | $29,569 | $51,829 | +$22,260 (+75.3%) |
| Reeves | $288,099 | $433,369 | +$145,270 (+50.4%) |
| Olla | $267,742 | $295,680 | +$27,938 (+10.4%) |
| Tullos | $398,383 | $435,744 | +$37,361 (+9.4%) |
| North Hodge | $68,122 | $74,351 | +$6,229 (+9.1%) |
| Robeline | $393,460 | $400,754 | +$7,294 (+1.9%) |
Eros accounts for the largest dollar and percentage increases among these eight entries. Its 2024 and 2025 statements report General Fund fines and forfeitures of $127,890 and $294,647, respectively. Both are accountant review reports, which provide a lower level of assurance than an audit. They should not be described as audited ticket-count findings.
The prior Eros figure appears in the 2024 report. The index labels that older entry Town of Eros, while the report itself identifies Village of Eros. They are treated as the same community, rather than two different municipalities.
Abita Springs and Franklinton have similar percentage increases—75.6% and 75.3%—but each increase is approximately $22,000. Their tables concern governmental activities, whereas the Eros comparison concerns its General Fund. Abita Springs labels the comparative 2024 column restated; this comparison uses that restated figure.
Reeves shows why growth and dependence are different measures
Reeves reports fines rising from $288,099 to $433,369. Its governmental-fund revenue also includes $706,685 for a town-hall grant project in 2025. As a result, a growing fine total can coexist with a lower share of total governmental-fund revenue.
For 2025, Reeves’s fines are 79.5% of its $545,281 General Fund revenue, but only 34.6% of its $1,251,966 revenue across the governmental funds in that statement. Neither percentage replaces the 50.4% year-over-year increase in the fine amount. A growth rate measures change over time; a revenue share measures reliance within a particular fund scope.
Three selected communities with decreases
| Community | 2024 reported | 2025 reported | Calculated change |
|---|---|---|---|
| Georgetown | $797,583 | $695,086 | −$102,497 (−12.9%) |
| Clayton | $452,812 | $348,366 | −$104,446 (−23.1%) |
| Urania | $196,000 | $137,159 | −$58,841 (−30.0%) |
Georgetown’s fines fall by $102,497, yet its total governmental-fund revenue rises from $846,592 to $1,216,105. The newer year includes $460,599 in intergovernmental maintenance income. That added revenue substantially changes the financial picture without reversing the decrease in fines.
Clayton’s reported fines and forfeits fall by $104,446, and Urania’s reported fines fall by $58,841. A report alone cannot establish whether those changes came from fewer citations, different payment timing, enforcement practices, case outcomes, or another cause. That would require citation-level and collection records.
What we compared—and what we excluded
The figures come from published financial statements or their comparative management discussion tables. We compared the same reported category within each town and kept the fiscal year consistent. We excluded budget-to-budget comparisons and figures that combine broad service charges with fines.
The category labels still differ: fines, fines and forfeitures, and fines and forfeits. None of the selected rows establishes a traffic-only total. We also retain the distinction between governmental activities, governmental funds, and the General Fund. Those distinctions limit comparisons of revenue size across communities, even when each community’s own year-over-year calculation is useful.
An accountant’s opinion applies to the relevant financial statements and must be read with the report. Clayton’s report includes a qualified opinion for governmental activities, while this comparison uses its governmental-fund table. Eros’s figures come from reviews. These qualifications are part of the evidence, not a reason to present an unsupported statewide winner.
What the results mean for drivers and local policy
A substantial revenue increase is a useful starting point for asking local officials about enforcement policy and collections. It does not prove that officers used quotas or that a particular citation was improper. A fine-revenue decrease likewise does not establish that a road became safer or that a driver is less likely to be stopped.
For an individual case, identify the issuing agency, court, alleged offense, and response deadline. If you need help reviewing a Louisiana ticket, send our team the citation. Our ticket-money guide explains why a total payment and the revenue ultimately retained by a town can be different amounts.
Sources checked October 2, 2026. Amounts are reported actuals for the fiscal years specified above; changes and percentages are our calculations. This is an eleven-community comparison, not a claim to identify Louisiana’s largest increases across every municipality.